
 Earth & Space
Mapping industrial and agricultural ammonia hotspots
Over 240 localized emission sources of ammonia have been identified using satellite observations. Emissions from the large majority of them are underestimated in the current emission inventories, preventing an accurate assessment of the health and environmental impacts of such pollution.
Because of its role in the formation of particulate matter, atmospheric ammonia is a key driver of air quality, with major impacts on human health and life expectancy. Excess ammonia also affects the entire biosphere through acidification and eutrophication of ecosystems and impacts indirectly climate. Human-related NH3 emissions originate mainly from agricultural, domestic and industrial activities, but both the total and the partitioning between the sources are highly uncertain, on all spatial scales.
The underlying reason for this uncertainty is that NH3 has a short atmospheric lifetime, which in turn leads to very large variations of its concentration in space and time. The sparse surface monitoring networks that are in place are therefore inadequate to monitor ammonia on representative spatial scales. The subsequent lack of information is a major obstacle to evaluate the impact of planned or implemented policies for air quality management. However, the availability of global satellite measurements is progressively compensating the limitation of the global in-situ monitoring system.
Among the numerous satellites flying within our atmosphere, those primarily used for weather forecasting can provide key information on the chemical composition of the atmosphere. For over 12 years, the Infrared Atmospheric Sounding Interferometers (IASI) launched onboard three successive MetOp satellites have been providing scientists with global data on various atmospheric components, including ammonia. How does it work? IASI, flying at an altitude of 817 km, measures the infrared radiation naturally emitted by the Earth. Once emitted by our warm terrestrial crust, this radiation is absorbed by the gases present in the atmosphere before reaching the detector on the satellite. Each atmospheric constituent has a specific spectral signature - similar to a unique fingerprint - that allows its unambiguous detection.
By analysing the data provided by the IASI infrared satellite, it is possible to determine the concentrations of the most important atmospheric gases, among which carbon dioxide and ozone, but also ammonia. However, ammonia concentrations are in general very small. It is only ten years ago that we have shown that IASI was able to measure ammonia.
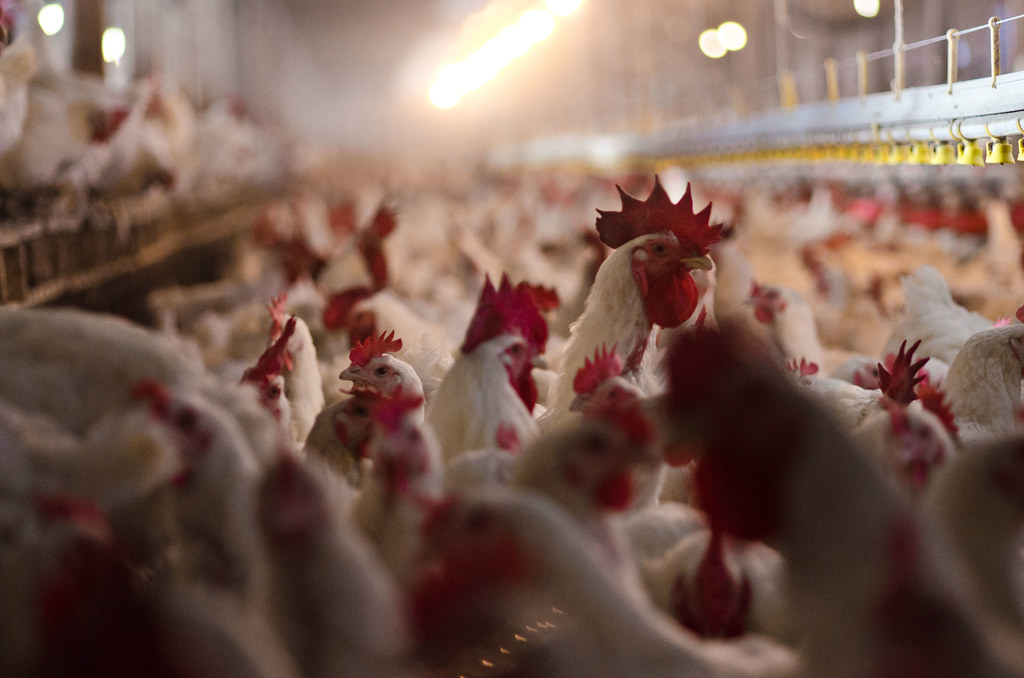
Using almost a decade of infrared measurements and a special averaging technique, we have generated the first high-resolution map (~1km²) of the global atmospheric distribution of ammonia (you can access to the map here). Analysing the map, country by country, we found strong but localised sources, also called "hotspots". In total, we identified and categorized more than 200 of such hotspots. We were surprised to see that most of these originated from the industry. In many cases, it was possible to pinpoint the exact location of the factory responsible for the emissions. These factories, located in all parts of the world, were mostly associated with the synthetic production of fertilizers. The other hotspots found are related to intensive agriculture, especially animal farming such as massive cattle feedlots -containing thousands of animals enclosed in confined quarters-, egg production centers, pig farming etc. We found these latter hotspots especially in Central and Northern America.
We have quantified the emission fluxes of each hotspot and discovered that emissions from industrial and agricultural point sources were drastically underestimated in the current bottom-up inventories, with 2/3 of the identified hotspots completely absent. The IASI satellite era (2007-...) also allows observing changes in human activities. Opening and closure of industrial sites were identified in Eastern Europe and China, as well as agriculture in transition in South America.
Space measurements point to the urgent need to revise current ammonia inventories. This is critically needed for assessing the health and environmental impacts of ammonia pollution and for implementing suitable nitrogen management strategies. Our study also demonstrates the coming of age of ammonia satellite measurements, which will be used in a near future to monitor the effect of legislation on ammonia emissions, and therefore be a powerful auditing tool for policy-makers.
Original Article:
M. Van Damme et al., Industrial and agricultural ammonia point sources exposed. Nature 564, 99-103 (2018)Next read: Keeping the balance: How epigenetics monitors cancer genes by Zach Gray , Madison Honer , Johnathan Whetstine
Edited by:
Massimo Caine , Founder and Director
We thought you might like
Vicious Circles – how changes in the shape of DNA can drive cancer
Aug 17, 2020 in Health & Physiology | 3.5 min read by Sihan Wu , Paul S. MischelThe crocodile that crossed an ocean
Aug 27, 2021 in Evolution & Behaviour | 3.5 min read by Massimo DelfinoHow does the brain orchestrate survival?
Dec 16, 2021 in Neurobiology | 4 min read by Shengjin Xu , Hui Yang , Scott M. SternsonFighting food pathogens with the help of a soil bacterium
Aug 16, 2019 in Microbiology | 3 min read by Rebecca McHughMore from Earth & Space
Discovery of the first radiation belt beyond the Solar System
Jan 27, 2025 in Earth & Space | 3.5 min read by Juan Bautista Climent OliverOne million (paper) satellites
Jan 24, 2025 in Earth & Space | 3 min read by Ewan Wright , Andrew FalleVolcanic Ash: A Nutrient Boost for Reef-Building Corals
Sep 18, 2024 in Earth & Space | 4 min read by Frank Förster , Tom SheldrakeAmmonia Energy: A Call for Environmental Awareness
Aug 29, 2024 in Earth & Space | 3.5 min read by Matteo Bertagni , Robert Socolow , Amilcare PorporatoLikely increase in coral thermal tolerance at a Pacific archipelago
Dec 29, 2023 in Earth & Space | 3 min read by Liam LachsEditor's picks
Trending now
Popular topics