 Maths, Physics & Chemistry
Three’s a crowd: group interactions in the real-world data, and how to find them
Discovering the complex interactions among variables in real-world events is critical, whether it is brain function, the financial market, or even epidemics. While traditional statistical tools only account for interactions between two variables, our new method examines group dependencies to understand more complex interactions in real-world data from neuroscience, economics, and epidemiology.

By collecting repeated measurements over time, researchers study trends, patterns and relationships in various systems - in financial markets, brain signals, or disease epidemics - that are not visible from a single point in time. But here's the catch - traditional statistical tools for analyzing time series mainly rely on pairwise interactions between variables. Real-world events, however, often depend on more than just two variables. As a result, such approaches may not always give us the full picture.
But what happens when more than two variables come into play? Just like how a group of friends in a pub discusses their vacation plan together, each contributing to create a more detailed plan, multiple variables in climate science, like temperature, humidity, and atmospheric pressure, interact with each other to produce complex weather patterns. Similarly, in the financial market, the prices of different stocks are influenced not only by the overall market trend, but also by the interactions between the stocks themselves. The interplay between groups of more than three variables is usually referred to as higher-order or group interactions.
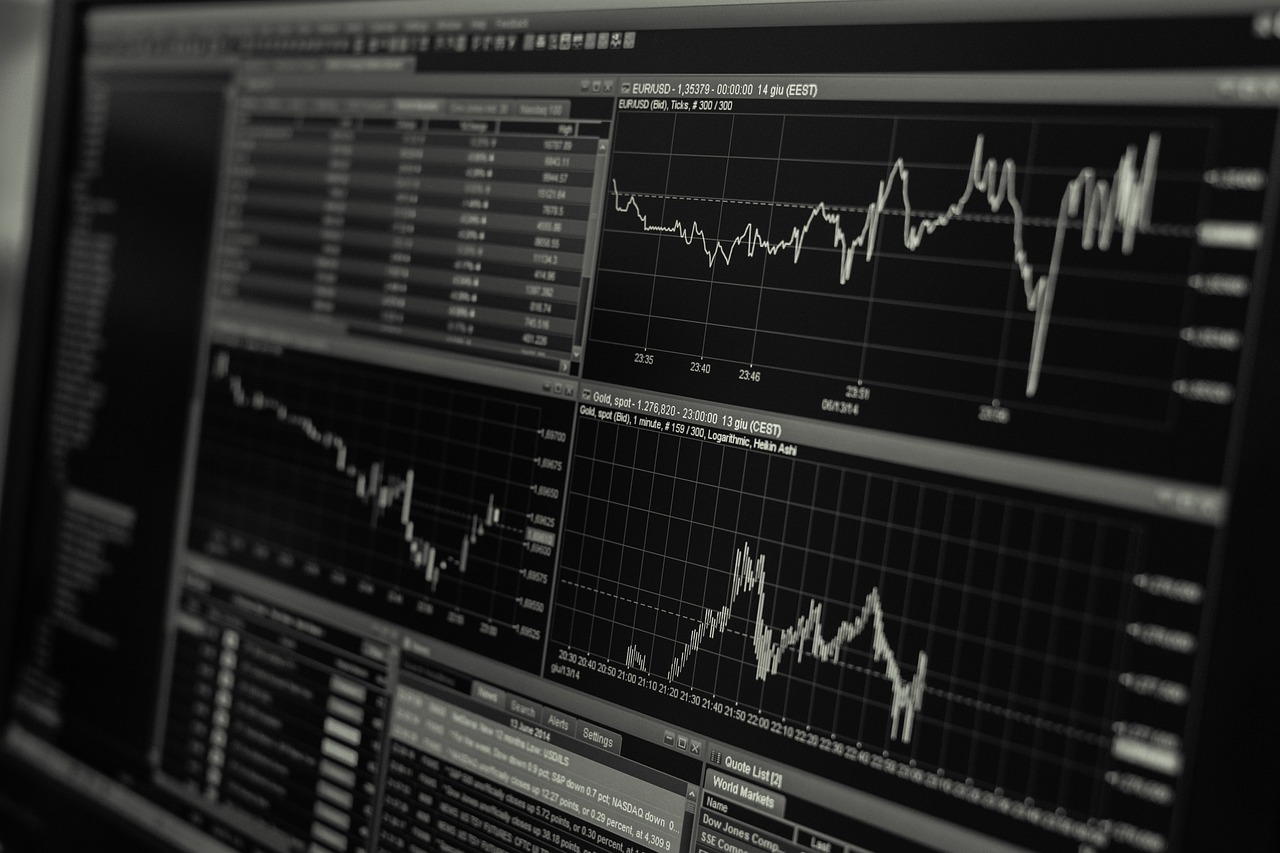
We also applied our approach to three complex real-world datasets, including brain activity, stock prices, and disease spreading in the 20th-century epidemics in the United States. In brain activity, we found different patterns of neural interactions oscillating between chaos and synchronization. In the stock market, we identified times of crisis and financial stability, and gained insights into the roles of different industrial sectors. In epidemiological data, one might expect that epidemics spread independently over time and space, but with our tool we were able to detect how different diseases interacted with each other over time, such as measles or flu.
Original Article:
Next read: Network resuscitation – pumping life into a failed complex system by Hillel Sanhedrai , Baruch Barzel
Edited by:
Zoé Valbret , Senior Scientific Editor
We thought you might like
More from Maths, Physics & Chemistry
Testing gravity through the distortion of time
Sep 20, 2024 in Maths, Physics & Chemistry | 3 min read by Sveva CastelloStacking molecular chips in multiple dimensions
Aug 30, 2024 in Maths, Physics & Chemistry | 3 min read by Lucía Gallego , Romain Jamagne , Michel RickhausReversible Anticoagulants: Inspired by Nature, Designed for Safety
Jun 12, 2024 in Maths, Physics & Chemistry | 4 min read by Millicent Dockerill , Nicolas WinssingerDistance-preserving moves always keep a point fixed
May 18, 2024 in Maths, Physics & Chemistry | 4 min read by Shaula FiorelliA resonance triggers chemical reactions between the coldest molecules
Apr 5, 2024 in Maths, Physics & Chemistry | 3 min read by Juliana Park , Wonyl ChoiEditor's picks
Trending now
Popular topics


